Background
We’ve been using Neo4j (https://neo4j.com/) for around five years in a variety of projects, sometimes as the main database (http://melodi.biocompute.org.uk/) and sometimes as part of a larger platform (https://gwas.mrcieu.ac.uk/). We find creating queries with Cypher intuitive and query performance to be good. However, the integration of data into a graph is still a challenge, especially when using many data from a variety of sources. Our latest project EpiGraphDB (https://epigraphdb.org/) uses data from over 20 independent sources, most of which require cleaning and QC before they can be incorporated. In addition, each build of the graph needs to contain information on the versions of data, the schema of the graph and so on.
Most tutorials and guides focus on post graph analytics, not how the graph was created. Often the process of bringing all the data together is overlooked or assumed to be straight forward. We are keen to provide access and transparency to the entire process and designed this pipeline to help with our projects, but believe this could be of use to others too.
Our data integration pipeline aims to create a working graph from raw data, whilst running checks on each data set and automating the build process. These checks include:
- Data profiling reports with pandas-profiling to help understand any issues with a data set
- Comparing each node and relationship property against a defined schema
- Merging overlapping node data into single node files.
The data are formatted for use with the neo4j-import tool (https://neo4j.com/docs/operations-manual/current/tutorial/import-tool/) as this keeps build time for large graphs reasonable. By creating this pipeline, we can provide complete provenance of a project, from raw data to finished graph.
The pipeline
The code and documentation for the pipeline are here – https://github.com/elswob/neo4j-build-pipeline
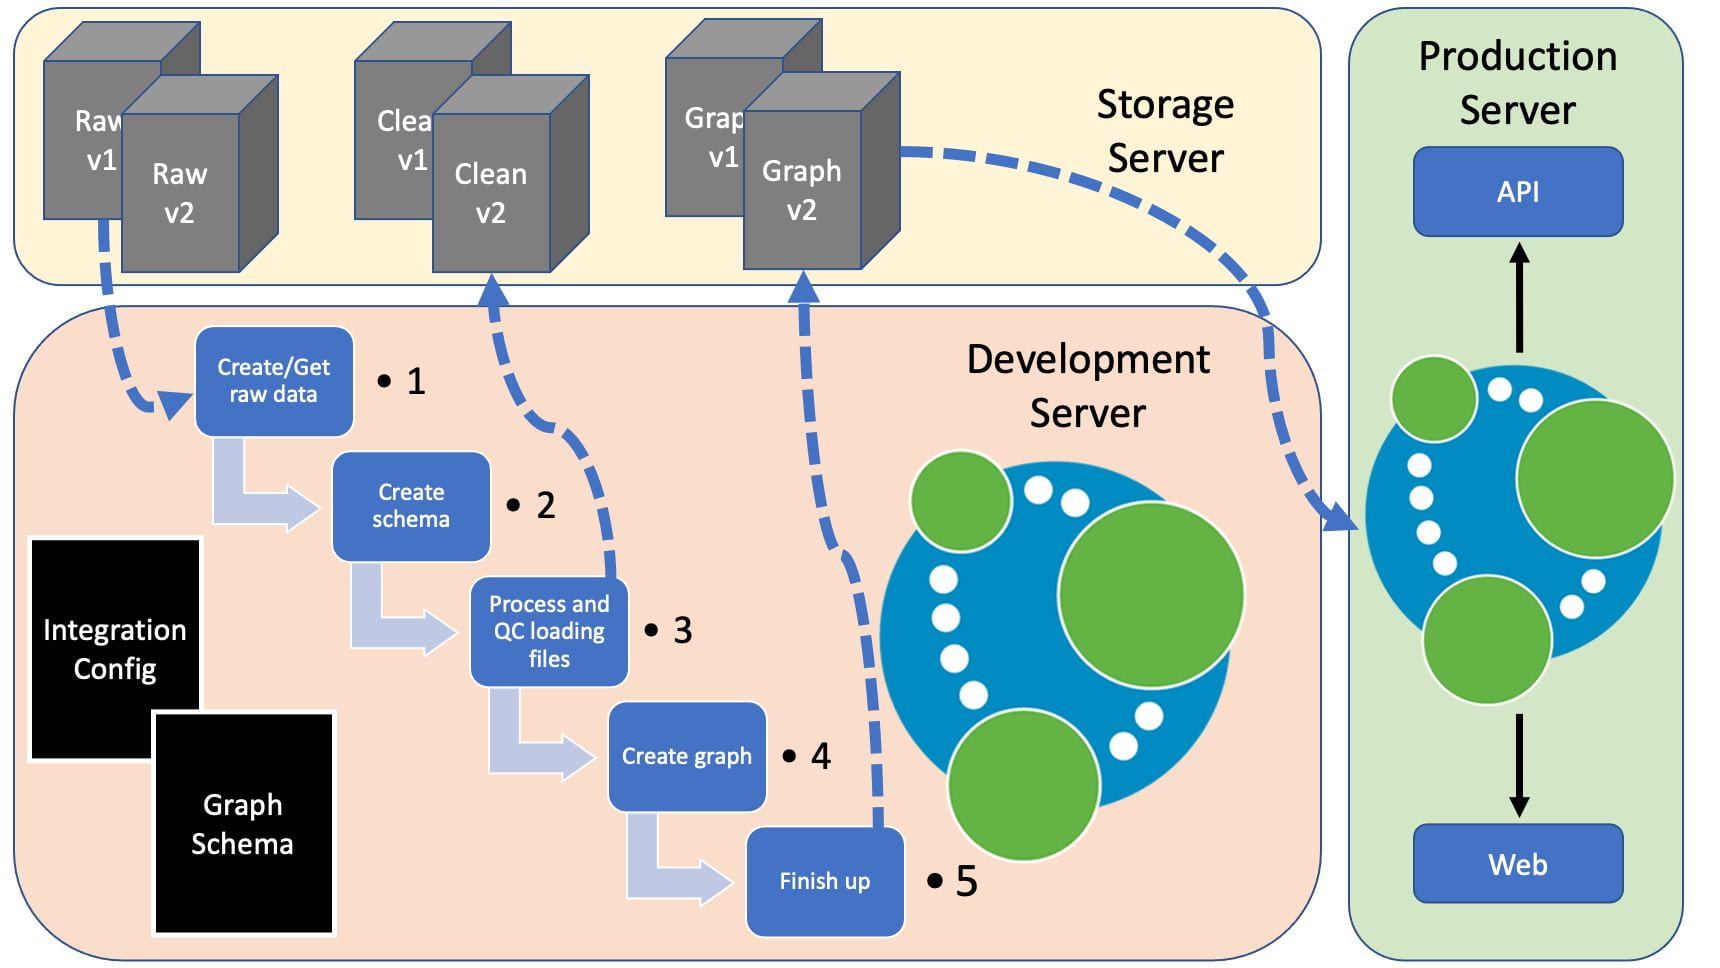
Below is a figure representing how this might fit into a production environment, with the pipeline running on a development server and shared data on a storage server.
Setup
The project comes with a set of test data (https://github.com/elswob/neo4j-build-pipeline/tree/main/test) that can quickly be used to demonstrate the pipeline and create a basic graph. This requires only a few steps, e.g.
# clone the repo (use https if necessary)
git clone git@github.com:elswob/neo4j-build-pipeline.git
cd neo4j-build-pipeline

# create the conda environment
conda env create -f environment.yml
conda activate neo4j_build

# create a basic environment variable file for test data
# works ok for this test, but needs modifying for real use
cp example.env .env

# run the pipeline
snakemake -r all --cores 4
For a new project, the steps to create a graph from scratch are detailed here and proceed as follows:
- Create a set of source data.
- These can be local to the graph or on an external server
- Scripts that created them should be added to the code base
- Set up a local instance of the pipeline
- Create a graph schema
- Create processing scripts to read in raw data and modify to match schema
- Test the build steps of individual or all data files and visualise data summary
- Run the pipeline
- Raw data are checked against schema and processed to produce clean node and relationship CSV and header files
- Overlapping node data are merged
- Neo4j graph is created using neo4j-admin import
- Constraints and indices are added
- Clean data are copied back to specified location
Future plans
We think the work we have done here may be of interest to others. If anyone would like to get involved in this project we would love to collaborate and work together towards refining and publishing the method. Comments also welcome.
Code: https://github.com/elswob/neo4j-build-pipeline
Email: ben.elsworth@bristol.ac.uk
Twitter: @elswob
